Activity 1, A Framework for Performance Testing.
Short Description:
Understand a framework for performance testing and describe the performance of selection sort.
Goals
When you finish this activity, you should have:
- Established a framework for performing wall clock testing of an implementation of an algorithm.
- Investigated the wall clock performance of selection sort.
Formal Description
Please perform the following steps. The steps labeled TASK: require you to add content to a document. It will probably be easiest to do this in word, but you can use whatever you wish. You will be using excel in this activity.
- TASK: Start a document, record questions and reactions to this process. This will be your final document for submissions
- Add the following to the top of your document
- Your name
- The names of any collaborators
- The percent of the problem solved using AI. (This may change as you work your way through the activity)
- Log into prog1, or do whatever you do with vsc to get a working environment on prog1
- make a directory for your work
- Hint:
mkdir activity1
- You will be using the code from this activity in a future homework assignment.
- Download the following files
- start.cpp
- Makefile
- Hint:
wget https://mirkwood.cs.edinboro.edu/~bennett/class/cmsc3140/fall2026/homework/act1/start.cpp
- Hint:
wget https://mirkwood.cs.edinboro.edu/~bennett/class/cmsc3140/fall2026/homework/act1/Makefile
- Make sure that everything compiles, and run the program
- Hint:
make.
- This program runs a sorting algorithm many times, it will take about 1/2 minute to run everything. Be patient.
- Hint:
./start
- TASK: Note any problems you encounter.
- Our next goal is to understand the pieces. Start at the top of the file start.cpp
- Note that this uses a number of parts of the standard c++ library
- algorithm for some simple functions like
swap, but you will use another function in your homework.
- random provides the current best practice random number generator
- chrono provides the best practice timing utilities
- vector provides a dynamic array, this one is worth learning if you don't know it.
- TASK:Provide a brief statement in your document describing your current knowledge of these four standard library elements.
- The TimerT class
- This is my creation, we really don't need a class, but this is easy to use.
- It is somewhat equivalent to a stopwatch.
- Start by looking at the private members
- A
time_point takes a clock and stores the current time value.
- This is somewhat equivalent to a
time_t with time
- But is much better
- The
high_resolution_clock is the best reliable clock on the system.
- So
start and end will both hold time in some abstract unit.
- A
duration is a difference in time
- So
diff will hold the difference between two times.
- The member functions support these operations.
-
Start() will start the stopwatch by recording the current time.
-
Stop() will stop the stopwatch and compute the time difference
-
Time() will return the difference in the requested unit.
-
DoExperiment uses this stopwatch
- The second unique element is random number generation
- Look at the function
GetRandomNumber.
- This uses the modern random number package
- a
random_device is a source of randomness
static random_device rd;
- This provides a seed to the RNG
- This is usually based on hardware or other external events to provide a true source of randomness.
-
random::mt19937 is a random number generator.
-
static mt19937 gen(rd());
- It is initialized with the random device declared above.
- Making it static means that it will be created just once on the first entry to the function.
- A uniform integer distribution is used to transform results to the range 0 to MAX_VALUE
-
static uniform_int_distribution <> distrib(0, MAX_VALUE);
- Note,
MAX_VALUE is a program declared constant.
- We want this to be large enough so that there are not too many repeats in the data.
- TASK: in your document describe the function of static when declaring a variable/class instance in a function. You might know this, or this might be a great place to either write some code and experiment or even work through it with an AI.
- Vectors
- TASK: in your document, describe the action of the following lines of code
-
vector<int> data;
-
data.push_back(GetRandomNumber());
-
data.size();
-
data[j]
-
DoExperiment
- This function:
- Generates an array of random integers
- Starts the stopwatch
- Sorts the data
- Stops the stopwatch
- Checks to see if the data was sorted correctly.
- Reports the time, comparisons and swaps used in the sort.
- TASK: look at
Check, describe at a high level the three possible failures that this function will detect. Can you think of any other contditions that should be tested?
- Note, this program produces output as a CSV (comma separated value) file.
- TASK: Run the program, and redirect the output to a file. Insert a screenshot of this into your document.
- Hint:
./start > datafile.txt
- Move
datafile.txt to somewhere you can run Microsoft Excel (or another spreadsheet that supports pivot tables.)
- wget, sftp, winscp, or something in vsc.
- TASK: Open the data file in a spreadsheet that supports pivot tables.
- (file-> open), set type to all files select the proper directory and open
datafile.txt.
- When you do this, excel will present you with an Text Import Wizard.
- Select Delimited if it is not selected and choose next
-
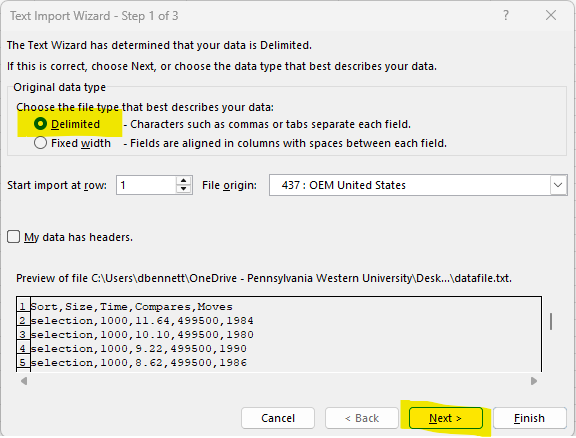
- Mark comma , and select finish.
-
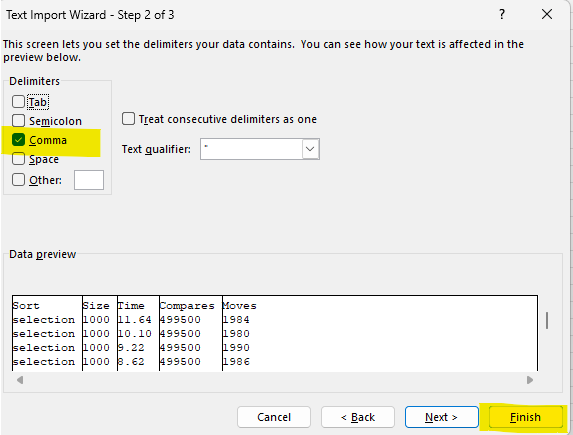 .
- Create a pivot table
- Select all of the data in the new worksheet
- Move to cell A1
- Press CRTL-SHIFT-DOWN, CRTL-SHIFT-RIGHT, or highlight all of the data.
-
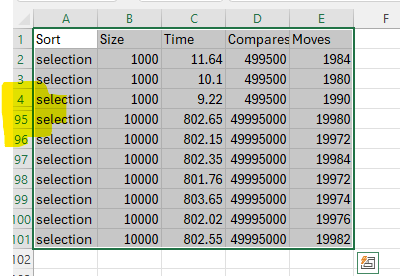
- Your entire data set should be selected (or grey)
- I have hidden some rows in the picture.
- Select Insert -> PivotTable to create a pivot table.
-
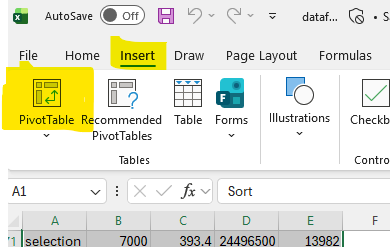
- Then select ok on the popup window.
- Populate the pivot table
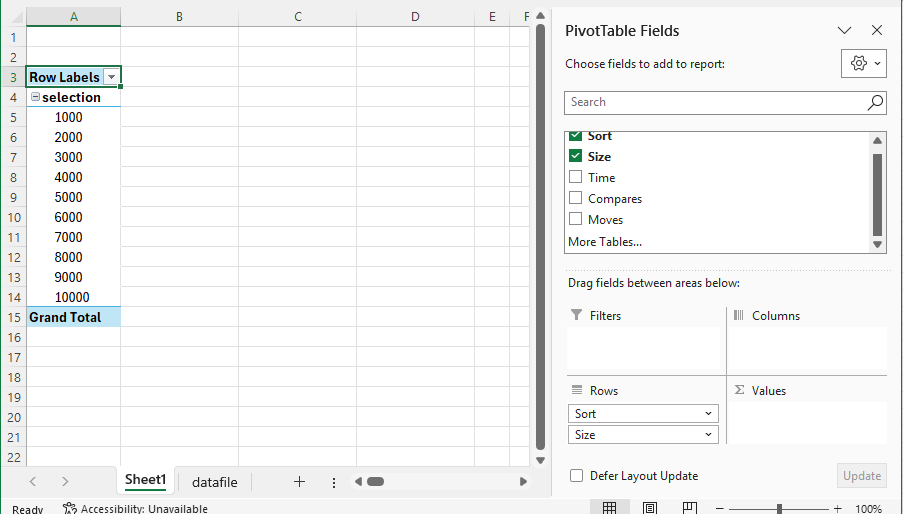
- Drag Sort down into the Rows area (literally click and hold on Sort and drag it into the box.)
- Drag Size into the Rows are under sort
-
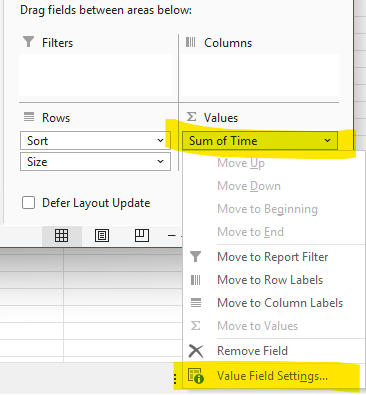
- Drag Time into Σ Values.
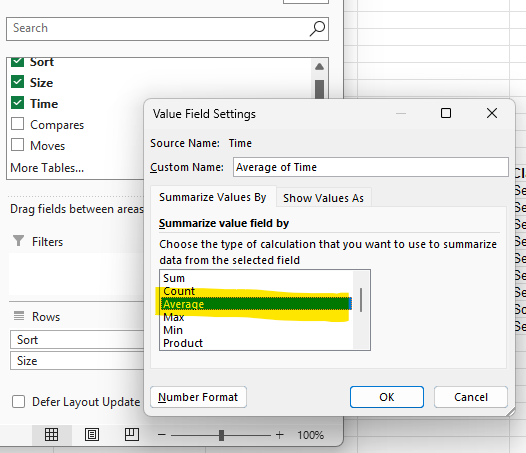
- You don't want the sum, so on drop down the menu select Value field settings and select Average in the popup box.
-
-
- You can do the same for Compares and moves.
- TASK: insert a copy of your pivot table (screen shot or active) in your document.
- Create a pivot chart
- If you need to select the PivotTable Analyze tab
-
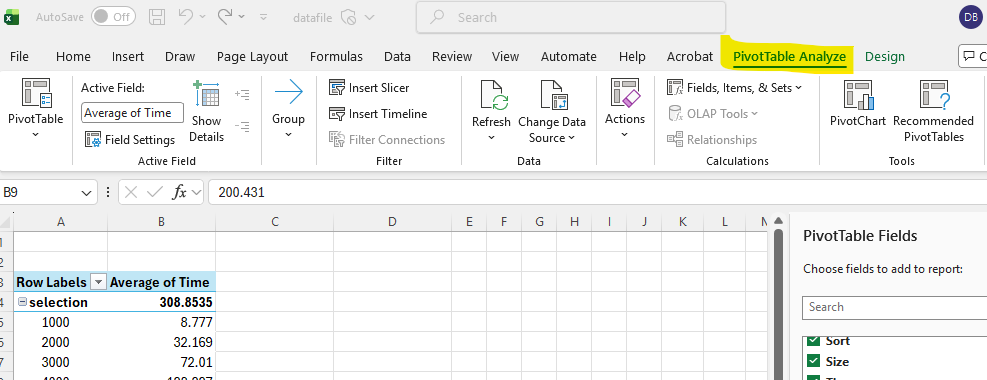
- And select PivotChart
- Select an appropriate chart (Line is good)
- Change the title (Big + sign, select title, change it), they should be time and array size.
-
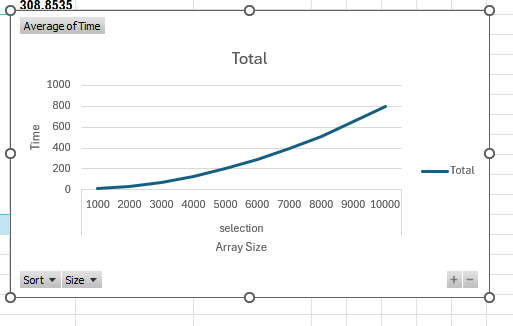
- TASK: Insert a copy of your pivot chart in your document.
- TASK: Discuss the data as presented in the pivot table and pivot chart for the time needed for selection sort.
- TASK: Create a pivot chart for both Compares and Moves
- You will probably need a separate chart for each, as they have different scales.
- Include each of these graphs in your document.
- Discuss each of these graphs.
- TASK: using the code in
SelectionSort explain why the time and comparison graphs are O(n2), while the moves graph appears to be O(n).
Notes
My datafile for discussion.
Required Files
A single document demonstrating that you have completed the above tasks.
Submission
Submit the assignment to the D2L folder Activity 1 by the due date.